需要使用的库
以下为使用Python来实现图像直方图均衡和匹配中需要用到的库
- PIL: 用于导入图片、修改图片、显示图片
- numpy:用于接收图像rawdata,方便处理多维数据数据
- matplotlib:用于画直方图、显示图像
Python推荐安装anaconda整合包,包括numpy在内的很多库已经安装好了。没有安装的库推荐用pip安装,这样可以不用考虑库之间的烦人的依赖关系。
以下源码均为自己实现
画直方图
使用matplotlib库中的 hist函数画直方图,步骤图下:
- 打开图像
- 导入图像的Rawdata
- 用生成hist生成直方图
代码如下:
1
2
3
4
5
6
7
8
| from PIL import Image
import numpy as np
import matplotlib.pyplot as plt
im = Image.open('chengbao.jpg')
buf = np.array(im)
plt.hist(buf.flatten(), 256, normed = True)
plt.show()
|
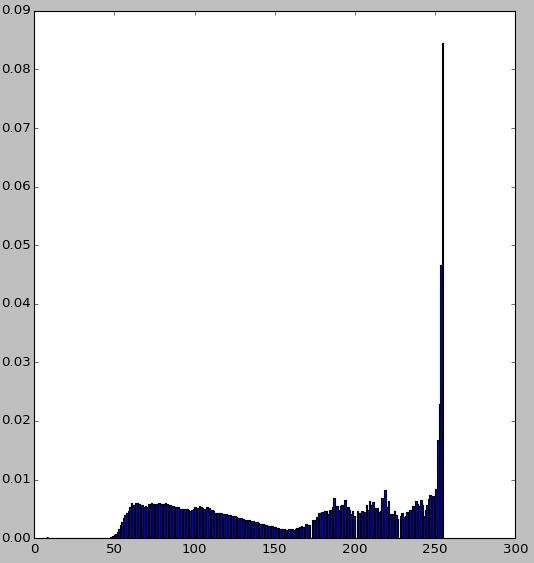
使用测试图像如下:

运行程序生成直方图如下:
实现直方图均衡化
图像直方图的均衡属于图像的点操作,直接用PIL库中的 point函数即可,point函数可以对图像中的每一个点都进行相同的处理,并返回一个新的图像。
直方图均衡的公式如下:
f(s) = Sum(P(0:s)) x (L-1)
用python一句话就可以实现。
于是可以在上面的代码的后面加入均衡化的功能:
1
2
3
4
5
6
| dhist, bins_edge = np.histogram(buf.flatten(), 256, density = True)
outIm = im.point(lambda i: sum(dhist[:i])*255)
outIm.show()
plt.hist(np.array(outIm).flatten(), 256, normed = True)
plt.show()
|
均衡化后生成的图像如下:

均衡化后的直方图为:
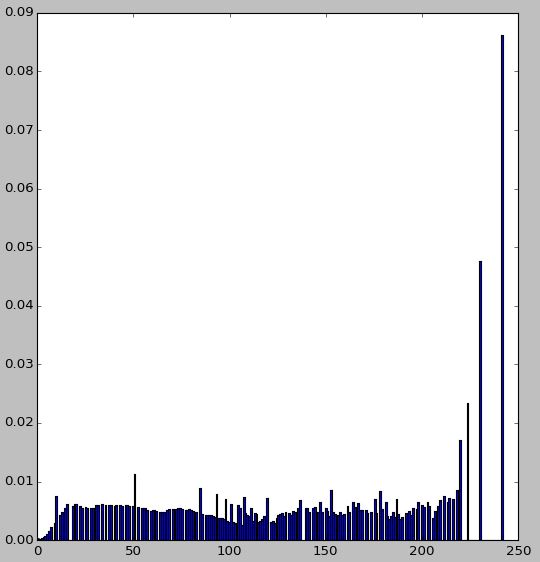
可以看到这幅图像在均衡化后,之前朦胧的地方变得更清晰了,但是其噪声也增多了和颗粒感也更严重了。
实现直方图匹配
虽然直方图的匹配会稍显复杂,但是并没有使用额外的知识点。只需要按照步骤一步一步实现代码就可以了。
所以我这里就直接贴全部代码,下面代码的目的是将原图像匹配到目标图像的直方图上,目标图像就是chengbao.jpg,其原始图像和直方图分布都上面(图1和图2):
1
2
3
4
5
6
7
8
9
10
11
12
13
14
15
16
17
18
19
20
21
22
23
24
25
26
27
28
29
30
31
32
33
34
35
36
37
38
39
40
41
42
43
44
45
46
47
48
49
50
51
52
53
54
55
56
57
58
59
|
from PIL import Image
import matplotlib.pyplot as plt
import numpy as np
def eqhist(histarray):
farr = np.zeros(256,dtype= np.uint16)
for i in range(256):
farr[i] = np.sum(histarray[:i])*255
if farr[i] > 255: farr[i] = 255
return farr
def main():
imlist = []
imlist.append(Image.open('chengbao.jpg'))
imlist.append(Image.open('target.jpg'))
srcIm = imlist[1]
targIm = imlist[0]
srcIm.show()
srcbuf = np.array(srcIm)
targbuf = np.array(targIm)
plt.subplot(2, 2, 1)
srchist, bins, patche = plt.hist(srcbuf.flatten(), 256, normed = True)
plt.subplot(2, 2, 3)
targhist, bins, patche = plt.hist(targbuf.flatten(), 256, normed = True)
resSrchist = eqhist(srchist)
restarghist = eqhist(targhist)
MapArray = np.zeros(256,dtype= np.uint8)
for x in xrange(256):
MapArray[restarghist[x]] = x
tmp = MapArray[0];
for x in xrange(1,256):
if MapArray[x] != 0:
tmp = MapArray[x]
else:
MapArray[x] = tmp
outIm = srcIm.point(lambda i: MapArray[resSrchist[i]])
plt.subplot(2, 2, 2)
plt.hist(np.array(outIm).flatten(), 256, normed = True)
outIm.show()
plt.show()
if __name__ == '__main__':
main()
|
执行结果如下:


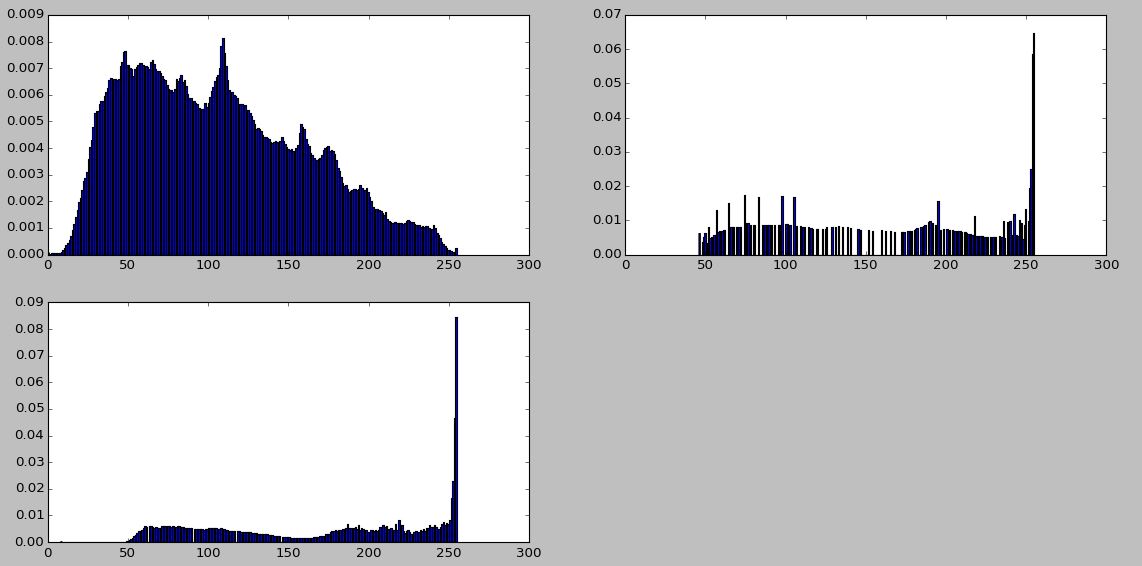
图7 直方图对比中,左上为原始图像的直方图,左下为目标图像的直方图,右上为匹配后图像的直方图。可以看到匹配后的直方图和目标图像的直方图是非常相似的。